Energy Visualization
Engineered.
WEVA (WAGO Energy Visualization App) provides precise monitoring and control for industrial Modbus devices. High-density data logging, local network security, and Docker-native reliability.
Interface Preview
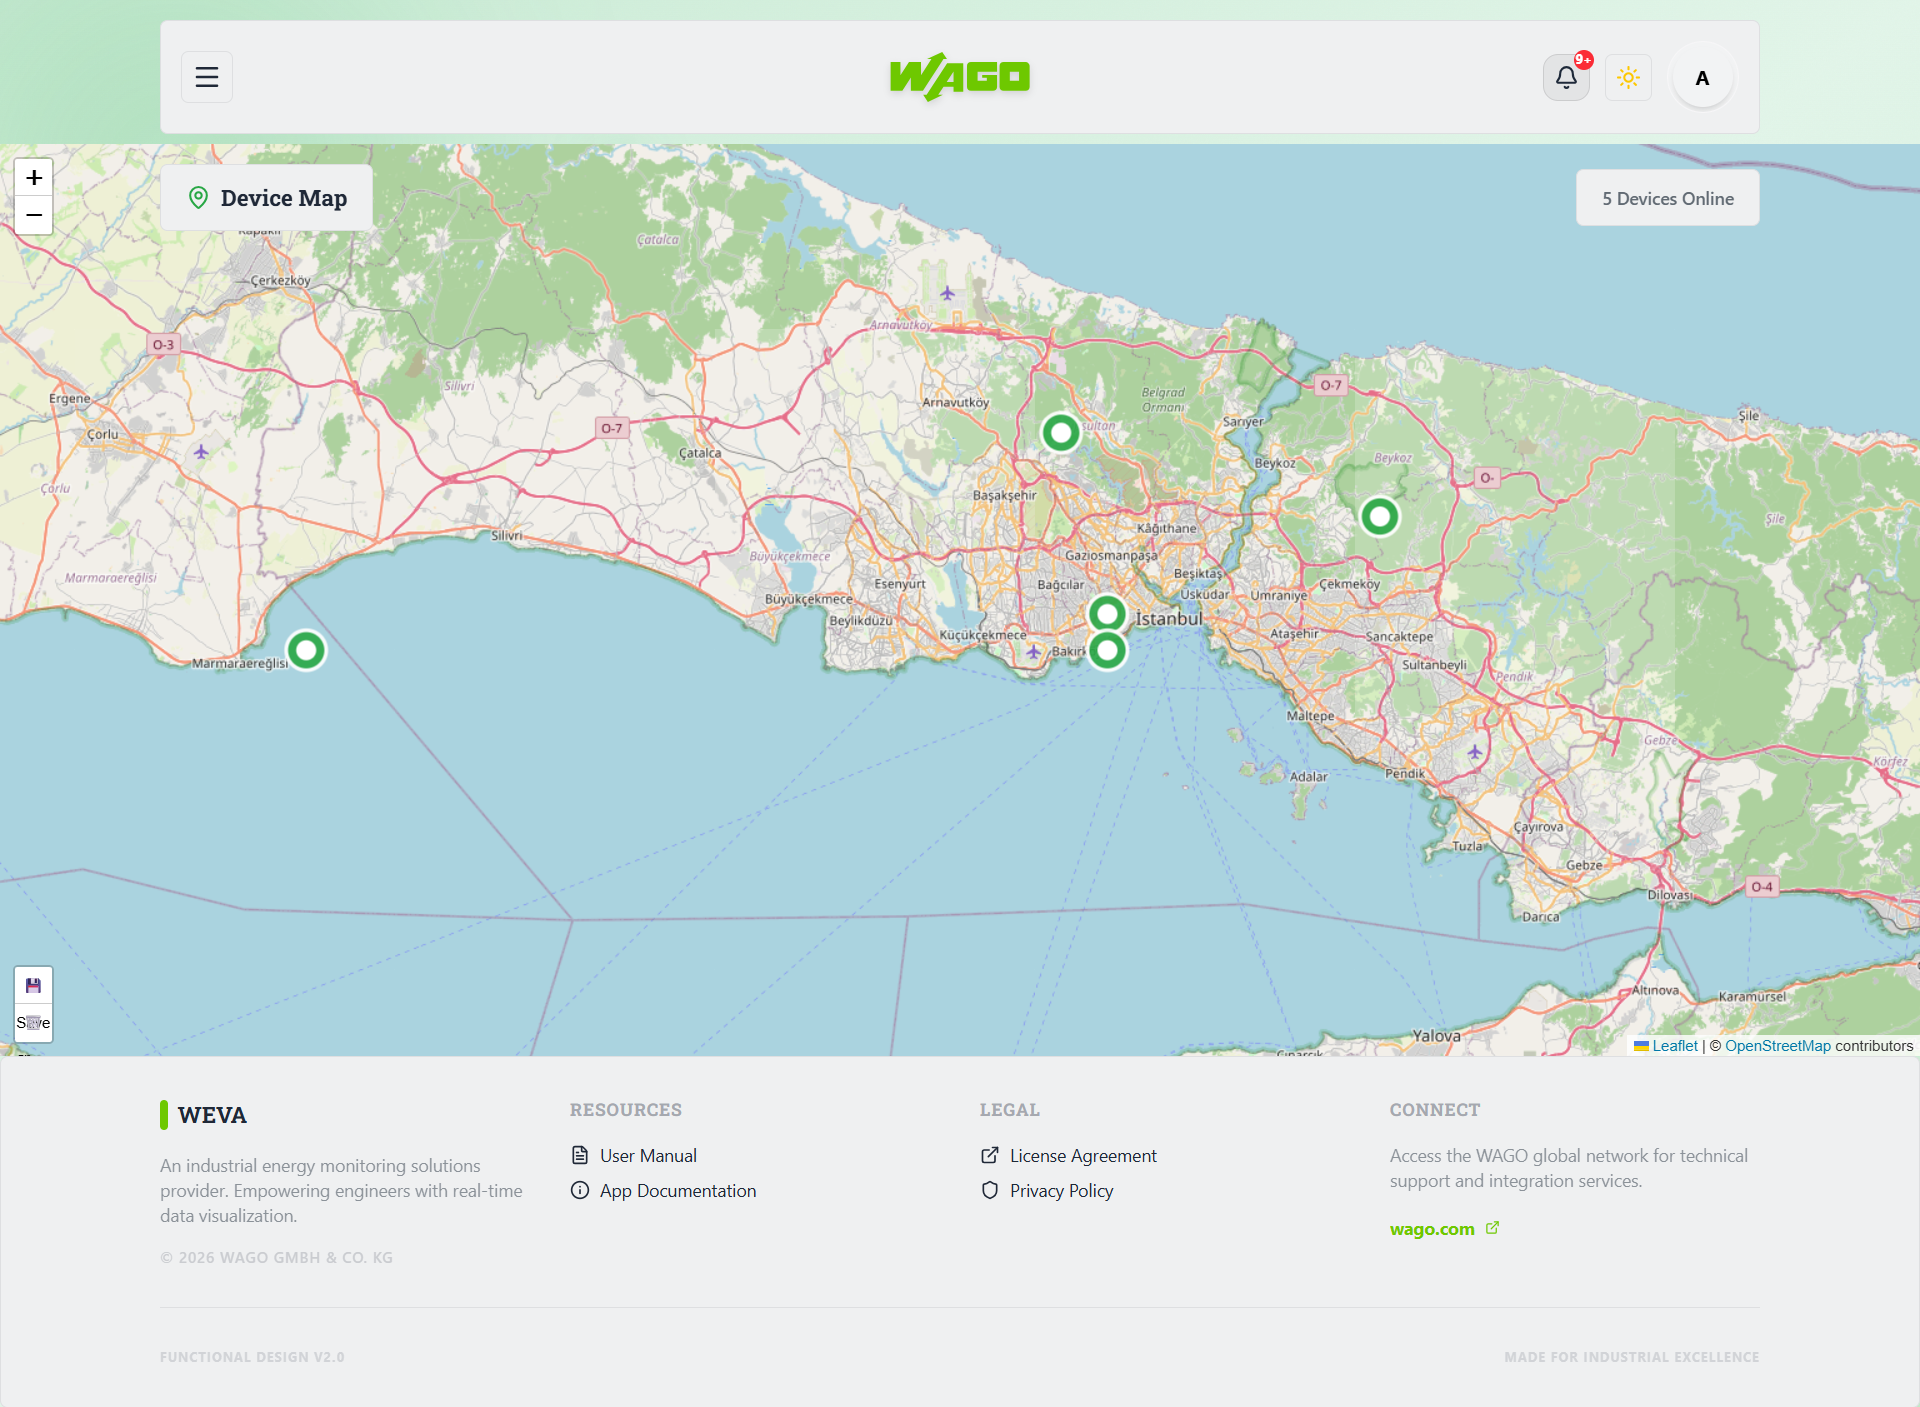
Power at your fingertips
Built for reliability. Designed for visibility.
Industrial Grade
Engineered specifically for plant environments. Deterministic polling and local network operation for maximum reliability.
Modbus Monitoring
Real-time visualization of device parameters. Real-time visualization and storage capabilities.
Network Server
Centralized host-client architecture. Access high-density dashboards from any browser in the local network.
SQL Data Storage
Robust data persistence for long-term analysis. Sequential logging of every Modbus entry.
Docker Optimized
Containerized deployment allows for air-gapped installation and zero-dependency host environments.
Data Sovereignty
100% offline-ready. Your sensitive energy meta-data remains strictly within your facility's firewall.
Ready to visualize your data?
Deploy WEVA today and take control of your Modbus device network.